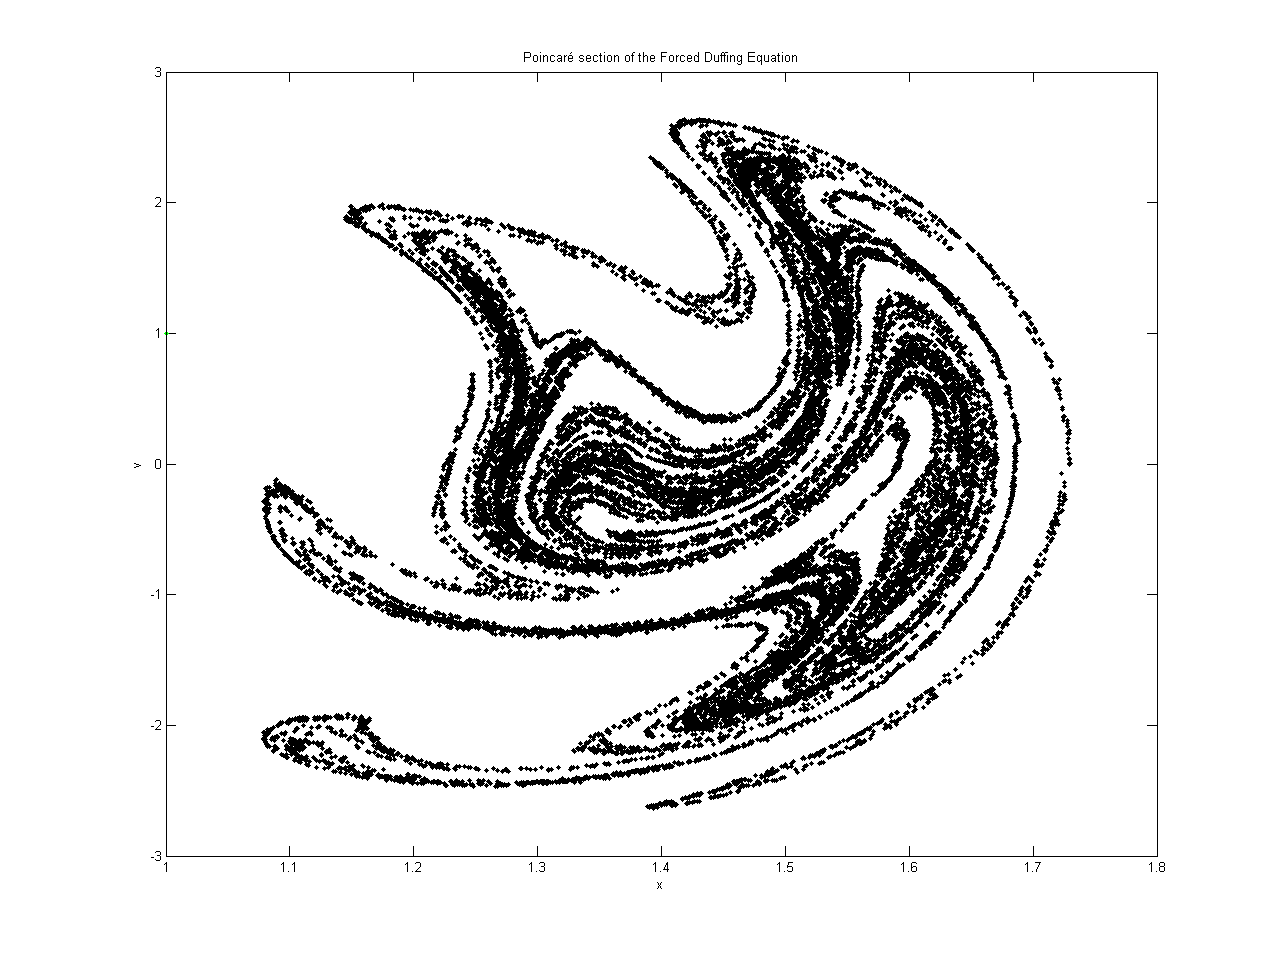


A Poincaré map is a type of dynamical system that describes how a system behaves over time. It is a graphical representation of the behaviour of a dynamic system over a period of time. It is used to analyze the behaviour of dynamical systems that can be described by a set of differential equations.
The Poincaré map was developed by French mathematician, Henri Poincaré, in the late 19th century. He developed this method to analyze the behaviour of dynamical systems. The Poincaré map was initially used to study the behaviour of celestial bodies like the planets and stars. Later, it was used to study the behaviour of other dynamical systems such as chemical reactions, electrical circuits and fluid flows.
To create a Poincaré map, a system is first defined by a set of differential equations. These equations describe how the system behaves over time. A set of "initial conditions" is then chosen that provide information about the system's starting state. These conditions are used to determine how the system will behave over time.
The Poincaré map is then created by plotting the system's behaviour over a given period of time. This plot is usually a one-dimensional graph of the system's state at specific intervals in time. This graph is then used to analyze the behaviour of the system.
The Poincaré map is a powerful tool for analyzing the behaviour of dynamical systems. It is used to study a wide range of systems including electrical circuits, chemical reactions, and fluid flows. By analyzing the behaviour of a system over time, the Poincaré map can provide insight into how the system behaves and may even allow for the prediction of future behaviour. This makes the Poincaré map an important tool for engineers and scientists.
We curate and publish daily updates from the field of AI and nonlinear systems.
Consider becoming a paying subscriber to get the latest!